


International accounts of the Republic of Moldova, 2015 (preliminary data)
OREANDA-NEWS. According to preliminary data, in 2015, the current account of the balance of payments recorded a deficit of US$ 464.24 million (down by 17.7 percent as compared to 2014), the capital account registered a surplus of US$ 22.83 million and the financial account recorded a net inflow of US$ 473.18 million. The international investment position of the Republic of Moldova remained net debit totaling US$ -5,713.43 million at the end of 2015, while the gross external debt of the Republic of Moldova reached US$ 6,338.39 million.
Table 1. Main macroeconomic indicators of the Republic of Moldova
|
UM |
2014 |
Q I 2015 |
Q II 2015 |
Q III 2015 |
Q IV 2015 |
2015 |
|
|
Gross domestic product in current prices |
MDL million |
112,050 |
24,423 |
28,527 |
35,890 |
33,011 |
121,851 |
|
Gross domestic product in current prices |
US$ million |
7,981 |
1,357 |
1,573 |
1,869 |
1,658 |
6,476 |
|
GDP, physical volume indices |
% |
104.6 |
104.8 |
102.5 |
96.3 |
96.7 |
99.5 |
|
Exports of goods, physical volume indices |
% |
102.0 |
106.0 |
107.0 |
96.0 |
97.0 |
|
|
Imports of goods, physical volume indices |
% |
101.0 |
101.0 |
96.0 |
95.0 |
91.0 |
|
|
Period average exchange rate |
MDL/USD |
14.0388 |
17.9989 |
18.1309 |
19.1982 |
19.9112 |
18.8161 |
|
Personal remittances / GDP |
% |
24.1 |
23.1 |
24.1 |
19.5 |
21.2 |
21.8 |
|
FDI flows (net incurrence of liabilities) / GDP |
% |
4.4 |
10.7 |
5.0 |
-0.8 |
3.8 |
4.2 |
Table 2. Contribution of the main components to the evolution of the BOP current account
|
2014 |
Q I |
Q II |
Q III |
Q IV |
2015 |
Change in share 2015 / 2014 |
|
|
% to GDP |
p.p. |
||||||
|
Current account |
-7.1 |
-10.5 |
-8.1 |
-6.3 |
-4.6 |
-7.2 |
-0.1 |
|
Trade balance |
-36.7 |
-34.8 |
-31.1 |
-27.8 |
-27.9 |
-30.0 |
6.7 |
|
Exports of goods and services |
36.7 |
44.0 |
40.2 |
31.4 |
40.2 |
38.3 |
1.6 |
|
Imports of goods and services |
73.5 |
78.8 |
71.3 |
59.1 |
68.1 |
68.3 |
-5.1 |
|
Primary income balance |
10.4 |
6.8 |
4.4 |
7.2 |
6.4 |
6.2 |
-4.1 |
|
Primary income inflow, of which: |
14.0 |
13.4 |
14.0 |
11.3 |
12.0 |
12.5 |
-1.5 |
|
Compensation of employees |
13.4 |
12.7 |
13.5 |
10.9 |
11.6 |
12.0 |
-1.3 |
|
Primary income outflow, of which: |
3.7 |
6.6 |
9.6 |
4.1 |
5.6 |
6.3 |
2.7 |
|
Investment income |
2.7 |
5.2 |
8.2 |
3.0 |
4.2 |
5.0 |
2.3 |
|
Secondary income balance |
19.3 |
17.4 |
18.7 |
14.3 |
16.9 |
16.6 |
-2.7 |
|
Secondary income inflow, of which: |
21.1 |
19.8 |
21.0 |
16.3 |
19.0 |
18.8 |
-2.3 |
|
Personal transfers |
12.7 |
12.4 |
12.8 |
10.3 |
11.5 |
11.6 |
-1.1 |
|
Current international cooperation |
4.3 |
3.5 |
3.0 |
2.4 |
3.1 |
3.0 |
-1.4 |
|
Secondary income outflow |
1.8 |
2.3 |
2.3 |
2.0 |
2.1 |
2.2 |
0.3 |
|
Capital account |
1.2 |
-0.3 |
0.6 |
0.5 |
0.5 |
0.4 |
-0.8 |
|
Net borrowing (current and capital account balance) |
-5.9 |
-10.8 |
-7.5 |
-5.8 |
-4.1 |
-6.8 |
-0.9 |
Table 3. Sources of coverage for the net borrowing, net financial flows, % to GDP
|
2014 |
Q I |
Q II 2015 |
Q III 2015 |
Q IV 2015 |
2015 |
Change in share 2015 / 2014 |
|
|
% to GDP |
p.p. |
||||||
|
Financial account |
-7.1 |
-14.6 |
-7.9 |
-4.3 |
-4.2 |
-7.3 |
-0.2 |
|
Direct investment, net, of which: |
-3.9 |
-10.5 |
-4.9 |
0.8 |
-3.6 |
-4.1 |
-0.2 |
|
Equity other than reinvestment of earnings |
-1.6 |
-0.9 |
-1.0 |
-0.8 |
-1.0 |
-0.9 |
0.7 |
|
Reinvestment of earnings |
-0.4 |
-3.1 |
-5.2 |
-0.8 |
-1.2 |
-2.5 |
-2.1 |
|
Debt instruments |
-1.9 |
-6.4 |
1.3 |
2.4 |
-1.4 |
-0.7 |
1.2 |
|
Portfolio investment and financial derivatives, net |
-0.2 |
-0.1 |
-0.2 |
-0.1 |
0.1 |
||
|
Other investment, net, of which: |
3.8 |
19.0 |
-3.3 |
-4.2 |
-1.4 |
1.6 |
-2.2 |
|
Currency and deposits, net |
2.3 |
19.0 |
-2.1 |
-0.2 |
-0.8 |
3.2 |
0.9 |
|
Loans, net |
0.1 |
1.7 |
0.9 |
-1.6 |
-1.2 |
-0.2 |
-0.3 |
|
Trade credit and advances , net |
-1.7 |
-1.8 |
-2.2 |
-2.5 |
0.5 |
-1.5 |
0.2 |
|
Other accounts payable / receivable, net |
3.1 |
0.1 |
0.1 |
0.1 |
0.1 |
-3.0 |
|
|
Change in reserve assets, net |
-6.7 |
-23.0 |
0.6 |
-0.9 |
0.8 |
-4.7 |
2.0 |
Note: (-) – net capital inflow, (+) – net capital outflow
Table 4. Main indicators of the international investment position
|
UM |
31.12.2014 |
31.03.2015 |
30.06.2015 |
30.09.2015 |
31.12.2015 |
|
|
Net international investment position |
US$ million |
-5,598.09 |
-5,544.92 |
-5,628.84 |
-5,623.84 |
-5,713.43 |
|
Stock of foreign assets / stock of foreign liabilities |
% |
39.9 |
38.6 |
38.2 |
37.9 |
36.9 |
|
Stock of foreign direct investment in domestic economy |
US$ million |
3,613.78 |
3,489.23 |
3,549.58 |
3,474.91 |
3,538.59 |
|
Share of foreign investment in the stock of foreign liabilities |
% |
38.8 |
38.7 |
39.0 |
38.4 |
39.1 |
|
Share of loans (without intercompany loans) in the stock of foreign liabilities |
% |
32.9 |
32.3 |
32.1 |
32.7 |
32.6 |
|
Stock of reserve assets |
US$ million |
2,156.63 |
1,752.26 |
1,787.80 |
1,769.37 |
1,756.81 |
|
Stock of reserve assets / Average monthly imports of goods and services |
months |
4.4 |
3.7 |
4.1 |
4.3 |
4.8 |
|
Official reserve assets / Short-term external debt |
% |
89.2 |
72.6 |
74.0 |
73.7 |
74.8 |
Chart 1. Indices of reserve assets adequacy, end of 2009-2015, US$ million
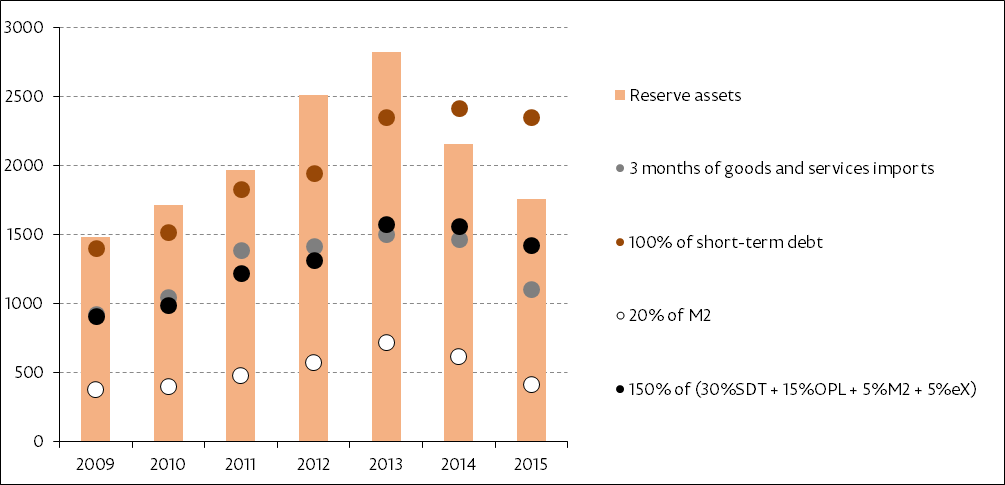
Note: The criteria are based on the IMF recommendations specified in "Assessing Reserve Adequacy - Specific Proposals", April 2015: http://www.imf.org/external/np/pp/eng/2014/121914.pdf
Table 5. Main indicators of the external debt
|
UM |
31.12.2014 |
31.03.2015 |
30.06.2015 |
30.09.2015 |
31.12.2015 |
|
|
Gross external debt |
US$ million |
6,570.26 |
6,393.53 |
6,414.45 |
6,421.10 |
6,338.39 |
|
Public and publicly guaranteed external debt |
US$ million |
1,731.05 |
1,651.93 |
1,685.18 |
1,712.77 |
1,702.04 |
|
Long-term external debt |
US$ million |
4,152.39 |
3,981.33 |
3,997.26 |
4,018.71 |
3,988.96 |
|
Share of public and publicly guaranteed external debt in gross external debt |
% |
26.3 |
25.8 |
26.3 |
26.7 |
26.9 |
|
Share of long-term external debt in gross external debt |
% |
63.2 |
62.3 |
62.3 |
62.6 |
62.9 |
|
Share of international organizations and foreign governments (creditors) in the external debt in the form of loans and SDR allocations |
% |
43.7 |
42.9 |
43.3 |
43.5 |
43.1 |
Комментарии